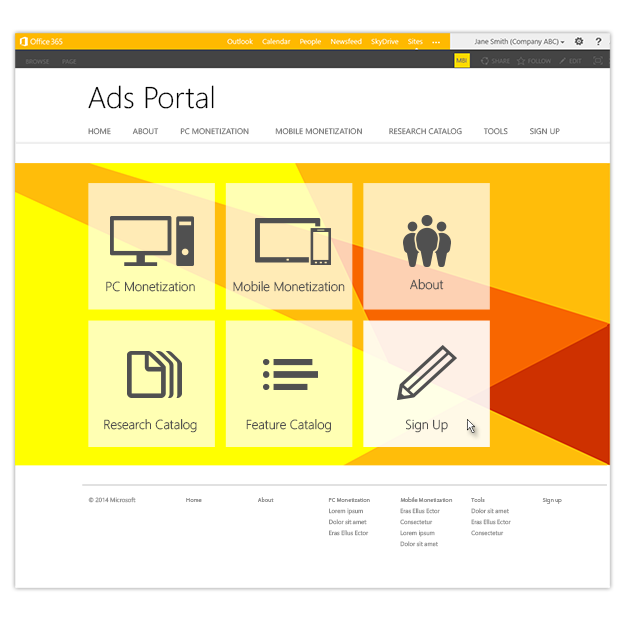
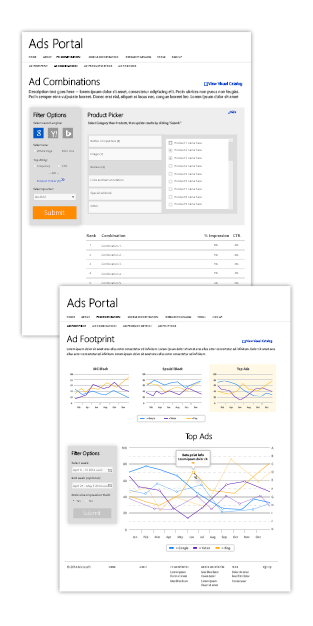
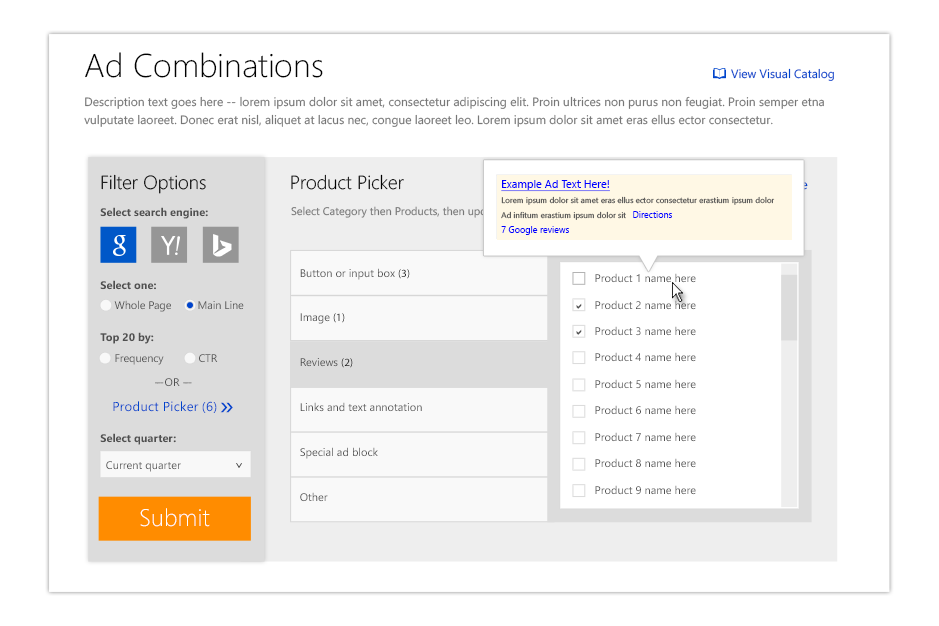
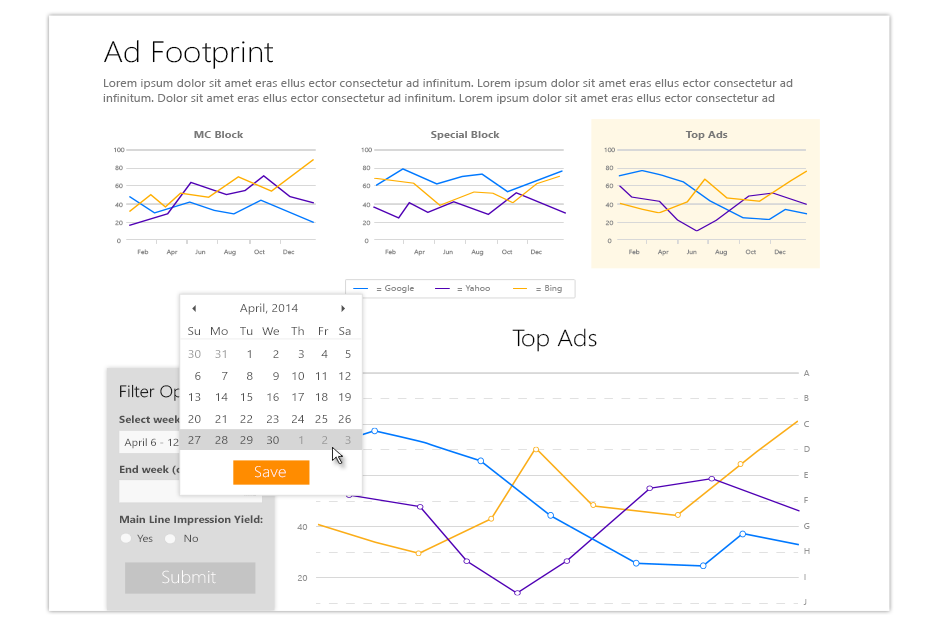
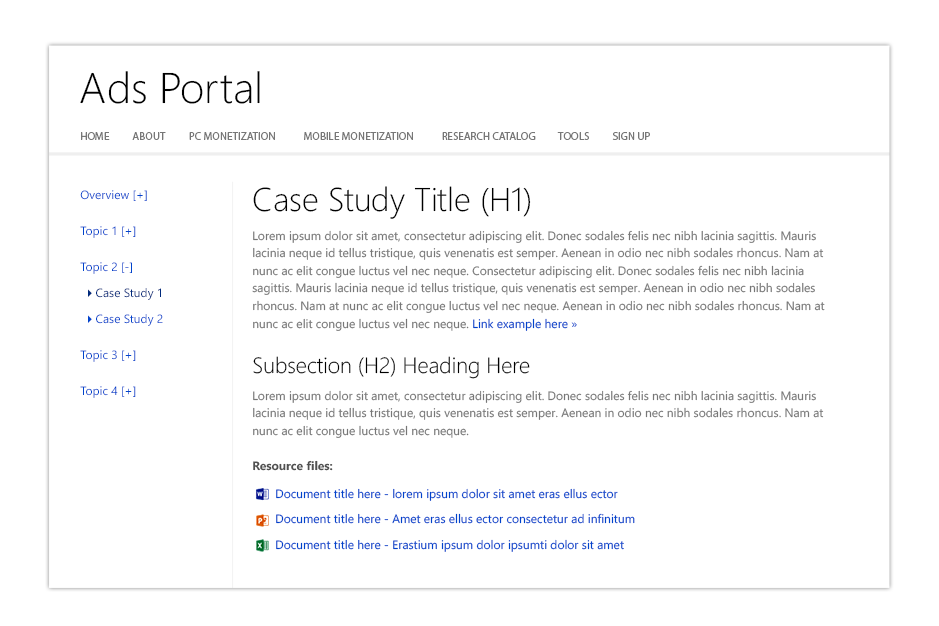
A research team at Microsoft engaged MediaPlant to design and develop a portal to give broad internal access to a specific set of data, and to provide a forum for storytelling around their insights. MediaPlant designed a series of customized, user-friendly dashboards for visualizing the data. Built on the SharePoint platform, the dashboards allow users to pivot the data using filters such as date ranges, product types, and combinations. The data is then displayed in visually compelling table or graph formats, with exportable reports. MediaPlant also created a visual catalog of items referenced in the site, and a wiki for case studies and other documents.
1904 3rd Ave, Suite 303
Seattle, WA 98101
Tel: 206.325.6737
Email: info@mediaplant.net
Copyright ©2024 MediaPlant. All rights reserved